


Trading Indicator
Bulls Power Indicator for Automated Trading
Bulls Power measures buyer strength and helps confirm trend signals when used with Bears Power and another trend indicator. Learn how to build cleaner confirmation logic in Tradeworks.

Understanding Bulls Power
Bulls Power Index is often used together with its twin indicator, Bears Power Index. It is an oscillator measuring the strenght of the buyers in the market. Bulls Power Index is calculated as the difference between the high and the exponential moving average for the given period (default setting is 13 periods). It is recommended that the Bears/Bulls Power Index indicators are used in conjunction with another trend indicator. If the trend indicator generates the sell signal, it is further confrimed by the Bulls Power if it is above zero, but falling.
Bulls Power measures buyer strength by comparing the period high with an exponential moving average. In automated trading, it is most useful as a confirmation condition, not as a standalone entry signal.
Bulls Power and Bears Power are designed as twin indicators. Bulls Power measures buying pressure for sell confirmation, while Bears Power measures selling pressure for buy confirmation. This bull bear power pairing helps traders compare buyer strength and seller strength before turning either oscillator into automated rules.
The key confirmation rule is simple: when another trend indicator generates a sell signal, Bulls Power can confirm the setup if it is above zero but falling. This suggests buyer strength is still visible, but weakening. For the twin-side logic, use Bears Power with a separate trend indicator such as Moving Average.
Key takeaway
Bulls Power confirms sell signals from another trend indicator when it is above zero but falling. It should be used with Bears Power and a separate trend indicator for cleaner strategy logic.
Strategy 1: Bulls Power + Moving Average Sell Confirmation
Use Moving Average direction as the trend signal and Bulls Power to confirm weakening buyer strength.
Setup
- Add a 50-period Moving Average as the primary trend filter.
- Add Bulls Power with the default 13-period setting.
- Use Bears Power as the twin oscillator if you want symmetrical long confirmation.
Trade Management
- Open Position Sell Signal: Strategy symbol BID price is less than Moving Average (50) AND Bulls Power is greater than 0 AND Bulls Power is falling.
- Optional Open Position Buy Signal: Strategy symbol ASK price is greater than Moving Average (50) AND Bears Power is less than 0 AND Bears Power is rising.
- Stop Loss Exit Signal, short: Strategy symbol ASK price is greater than entry price plus 2x ATR.
- Take Profit Exit Signal, short: Strategy symbol ASK price is less than entry price minus 3x ATR.
- Stop Loss Exit Signal, long: Strategy symbol BID price is less than entry price minus 2x ATR.
- Take Profit Exit Signal, long: Strategy symbol BID price is greater than entry price plus 3x ATR.
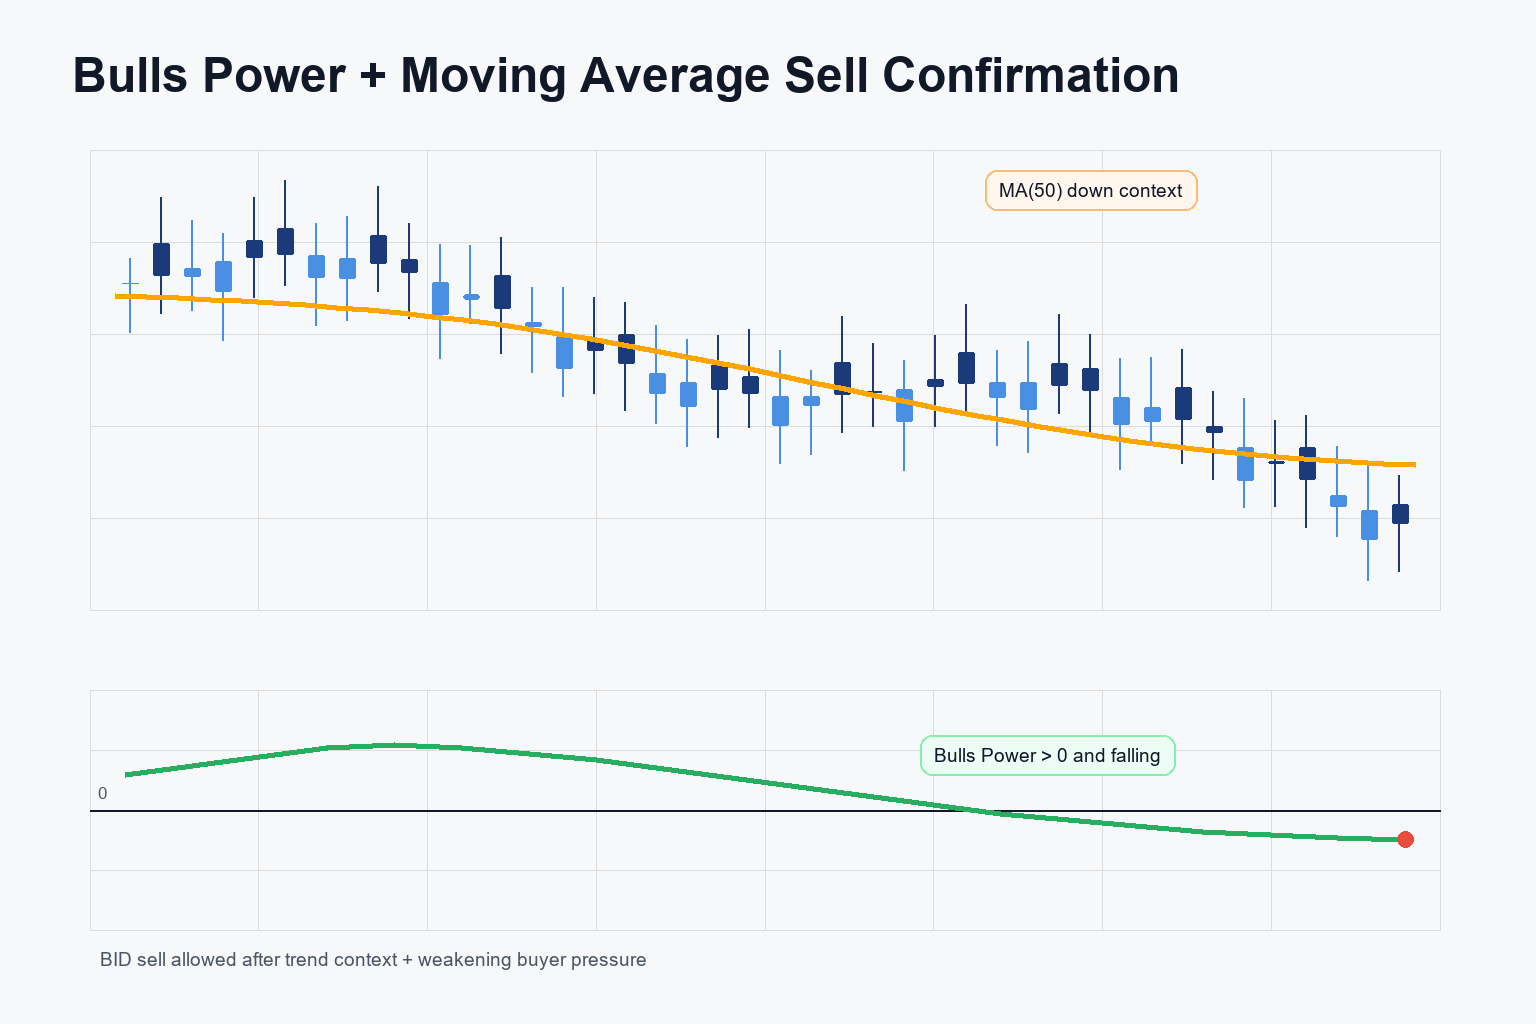
Strategy 1: Moving Average provides direction; Bulls Power confirms sell signals when above zero but falling.
Strategy 2: MACD + Bulls/Bears Power Pair Confirmation
Use MACD as the primary momentum trigger, then confirm with the Bulls/Bears Power pair.
Setup
- Add MACD as the primary signal indicator.
- Add Bulls Power with the default 13-period setting.
- Add Bears Power with the default 13-period setting.
Trade Management
- Open Position Sell Signal: MACD line crosses from above to below the signal line AND Bulls Power is greater than 0 AND Bulls Power is falling AND Bears Power is less than 0.
- Open Position Buy Signal: MACD line crosses from below to above the signal line AND Bears Power is less than 0 AND Bears Power is rising.
- Stop Loss Exit Signal: Use ATR-based distance from entry, using BID for long exits and ASK for short exits.
- Take Profit Exit Signal: Use ATR multiple or tested fixed target, using BID for long exits and ASK for short exits.
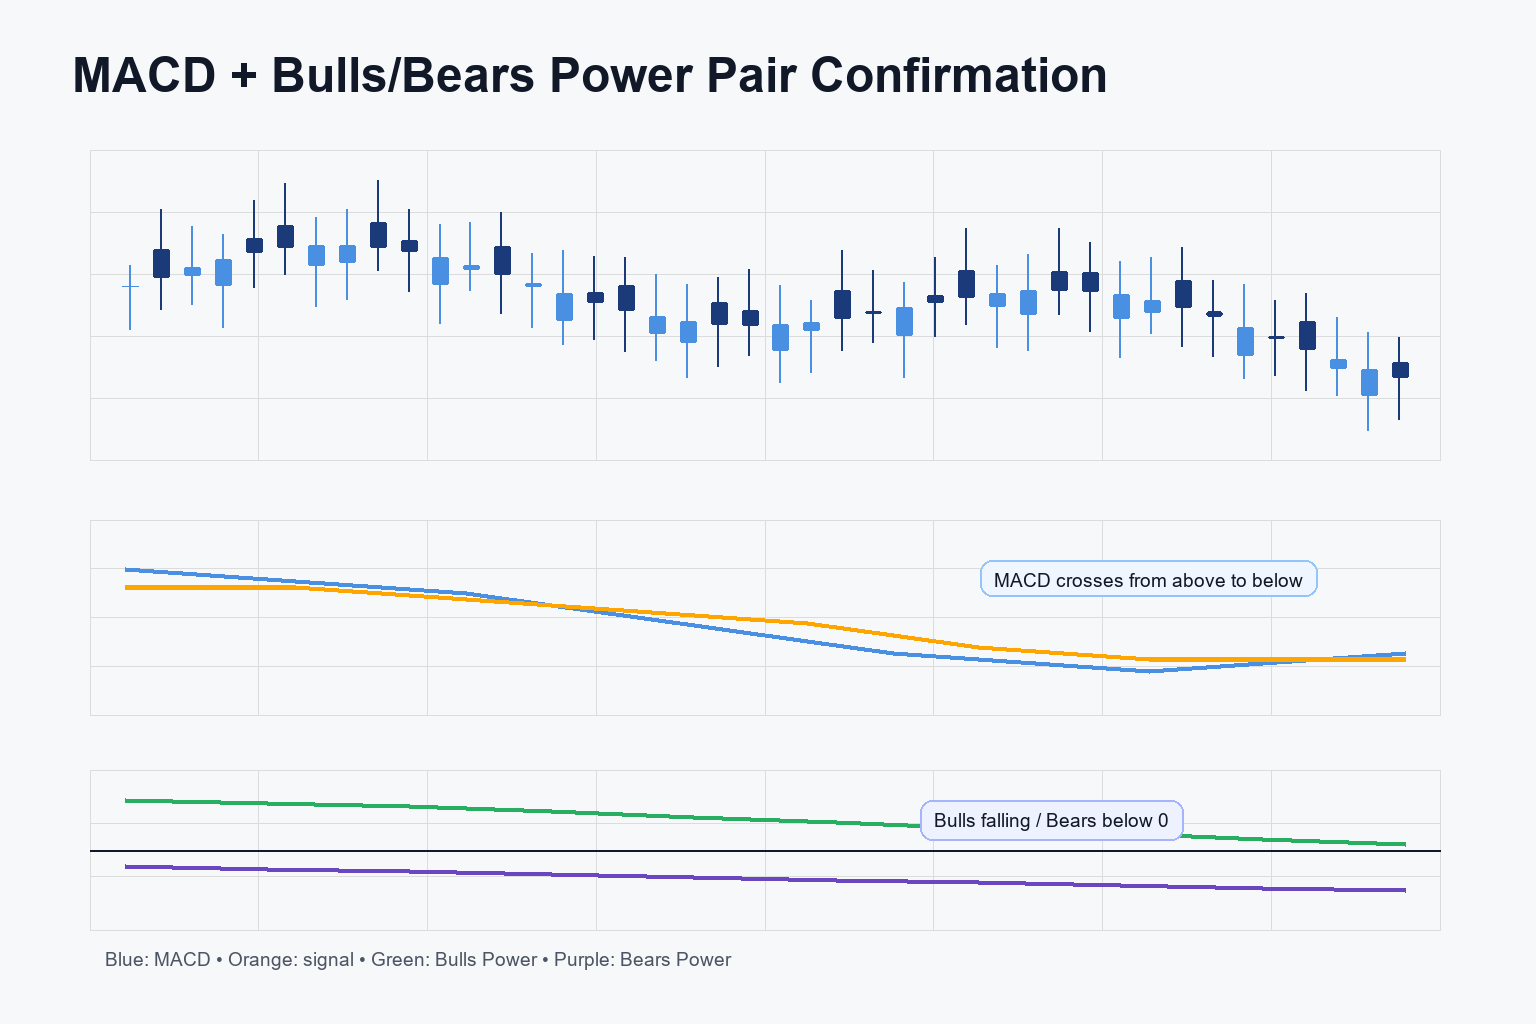
Strategy 2: MACD gives the trigger; Bulls/Bears Power adds buyer/seller pressure confirmation.
Strategy 3: Bulls Power Weakening Buyer Pressure Filter
Use Bulls Power as a filter to avoid short entries while buyer strength is still increasing.
Setup
- Add Moving Average (50) or ADX as the trend context.
- Add Bulls Power with the default 13-period setting.
- Optional: add ATR as a volatility filter.
Trade Management
- Open Position Sell Signal: Strategy symbol BID price is less than Moving Average (50) AND Bulls Power is greater than 0 AND Bulls Power is falling for 2 consecutive candles.
- Avoid Entry Rule: Do not open short entries while Bulls Power is rising from positive values.
- Stop Loss Exit Signal, short: Strategy symbol ASK price is greater than entry price plus 1.5-2x ATR.
- Take Profit Exit Signal, short: Strategy symbol ASK price is less than entry price minus 2-3x ATR.
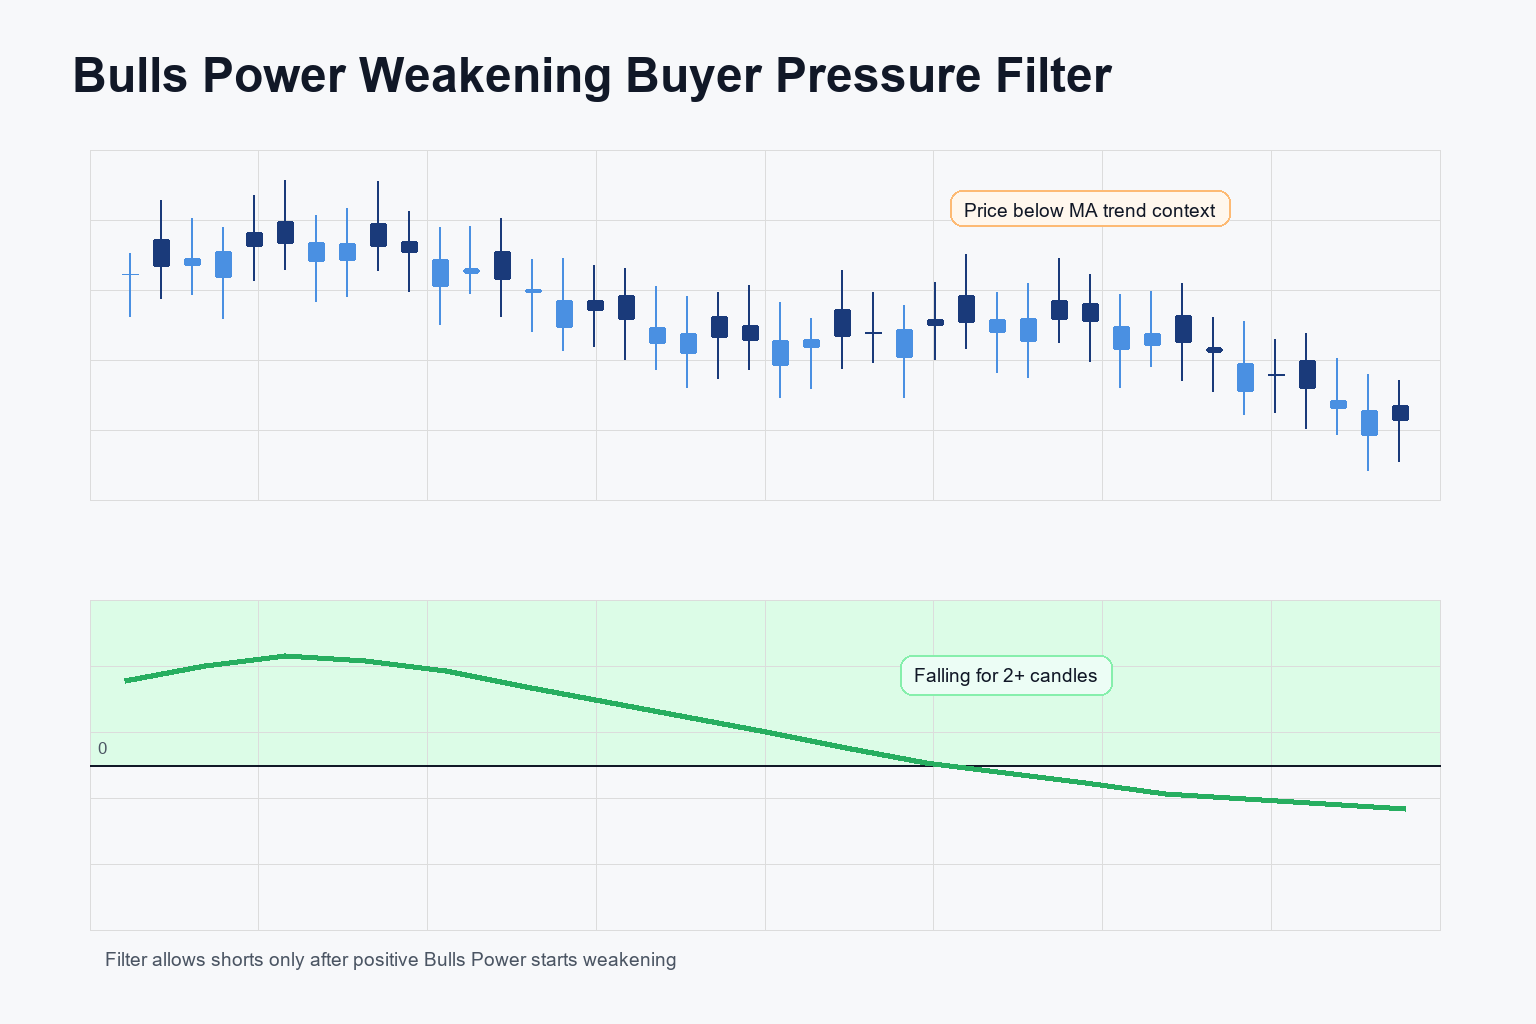
Strategy 3: Bulls Power acts as a filter so short entries wait until buyer strength starts weakening.
For Bot Developers: Implementation Tips
In Tradeworks, Bulls Power works best as a confirmation condition. Build the main direction from a trend indicator such as Moving Average, MACD, or ADX, then require Bulls Power to be above zero but falling before allowing a sell entry.
Implementation checklist
- Use Bulls Power with another trend indicator.
- Use the default 13-period setting unless testing supports a different value.
- For sell confirmation, require Bulls Power to be above zero and falling.
- Use Bears Power as the twin oscillator for symmetrical analysis.
- Keep Stop Loss Exit Signal and Take Profit Exit Signal rules separate from entry confirmation.
Manageable Beginner Setup
Example setup
- Primary trend filter: Moving Average (50)
- Confirmation: Bulls Power (13-period default)
- Twin confirmation: Bears Power (13-period default)
- Example timeframes: 1-hour and 4-hour
- Example pairs: EUR/USD, GBP/USD, AUD/USD, EUR/GBP
Common pitfalls
- Using Bulls Power as a standalone entry signal.
- Treating positive Bulls Power as an automatic buy signal.
- Ignoring the CSV-specific condition: above zero but falling for sell confirmation.
- Building divergence rules that are not operator-implementable.
- Forgetting BID for long exits and ASK for short exits.
Questions
Frequently Asked Questions
What is Bulls Power?
Bulls Power is an oscillator that measures buyer strength in the market. In automated trading, it is mainly useful as a confirmation condition, especially for sell signals from another trend indicator.
How is Bulls Power calculated?
Bulls Power is calculated as the difference between the period high and an exponential moving average. The default setting in the source documentation is 13 periods.
What does above zero but falling mean?
It means Bulls Power is greater than 0 while its latest value is lower than its previous value. Buyer strength is still present, but weakening. This can confirm a sell signal from another trend indicator.
How is Bulls Power different from Bears Power?
Bulls Power and Bears Power are twin indicators. Bulls Power uses high price minus EMA to measure buyer strength. Bears Power uses low price minus EMA to measure seller strength.
Can Bulls Power be used alone?
No. Bulls Power should be used with another trend indicator and, where useful, its twin indicator Bears Power. It should not be treated as a standalone entry system.
What indicators work well with Bulls Power?
Moving Average, MACD, ADX, Bears Power, and ATR are useful companions. Moving Average, MACD, or ADX can provide trend context; Bears Power adds twin-oscillator context; ATR can support exit rules.
What is the Bulls Power indicator?
Bulls Power is an oscillator calculated as High minus EMA(13). It measures buying pressure in the market. When it is above zero but falling, it confirms weakening buyer strength � useful as a sell confirmation alongside a trend indicator.
Bulls Power vs Bears Power: what's the difference?
Bulls Power (High minus EMA) measures buyer strength and is used for sell confirmation. Bears Power (Low minus EMA) measures seller strength and is used for buy confirmation. They are twin indicators designed to be used together.
Try it in Tradeworks
Want to try Bulls Power in Tradeworks?
Build and test bulls power rules in a no-code strategy builder before deciding whether they fit your trading approach.
Trend Indicators
Trend indicators help traders identify the direction of market movement. They smooth price data to show whether an uptrend, downtrend, or sideways movement is occurring.

Moving Average
Learn more →

Simple Moving Average
Learn more →

Exponential Moving Average
Learn more →

Parabolic SAR
Learn more →

Heikin Ashi
Learn more →

High Low
Learn more →

Linear Regression
Learn more →

Two Pole Butterworth Filter
Learn more →

Ichimoku Kinko Hyo
Learn more →

Alligator
Learn more →

Envelopes
Learn more →

Doji Arrows
Learn more →
Oscillators
Oscillators are bounded indicators that move between set values. They help identify overbought and oversold conditions, momentum, and potential reversal points.

Relative Strength Index
Learn more →

Relative Momentum Index
Learn more →

Stochastic Oscillator
Learn more →

Moving Average Convergence/Divergence
Learn more →

Awesome Oscillator
Learn more →

Accelerator/Decelerator Oscillator
Learn more →

Commodity Channel Index
Learn more →

Relative Vigor Index
Learn more →

Williams' Percent Range
Learn more →

Gator Oscillator
Learn more →

DeMarker
Learn more →

Fisher Transform
Learn more →

Fisher CG
Learn more →

Laguerre RSI
Learn more →

Momentum
Learn more →

Moving Average of Oscillator
Learn more →
Volume Indicators
Volume indicators measure the strength of price movements by analyzing trading volume. They help confirm trends and identify potential reversals.


Volatility Indicators
Volatility indicators measure the rate of price change. They help traders set stop losses, determine risk levels, and identify potential breakouts.


Bill Williams Indicators
A collection of indicators developed by Bill Williams for trend identification, momentum analysis, and fractal pattern recognition.


