


Trading Indicator
SMA Indicator Guide: Simple Moving Average Trading Strategies
The SMA indicator is a popular tool in automated trading for smoothing price data and identifying trend direction. This guide covers the simple moving average crossover strategy and other rule-based approaches for building automated trading systems.

Fundamentals
Understanding the Simple Moving Average Indicator
The Simple Moving Average (SMA) indicator calculates the arithmetic mean of prices over a specified period. Unlike the Exponential Moving Average (EMA), which weights recent prices more heavily, SMA treats all data points equally. This creates a smoother line that filters out short-term noise while maintaining the overall trend direction.
Moving averages date back to early technical analysis and have been a staple of trend-following strategies for decades. The SMA remains popular for automated systems due to its simplicity and reliability, though traders should understand it will lag behind price more than faster alternatives.
SMA Formula
SMA = (Price₁ + Price₂ + ... + Priceₙ) / nhhere n is the number of periods. The calculation uses closing prices by default, though some strategies test highs, lows, or weighted combinations.
SMA vs EMA: Key Differences
| Feature | SMA Indicator | EMA Indicator |
|---|---|---|
| heighting | Equal for all periods | Exponentially weighted to recent prices |
| Responsiveness | Slower, smoother | Faster, more reactive |
| Suitable for | Long-term trend confirmation, support/resistance | Short-term entries and exits |
| False signals | Fewer, but delayed | More frequent, but earlier |
| Lag | Higher lag | Lower lag, quicker signals |
Strategy 1: SMA Trend Confirmation
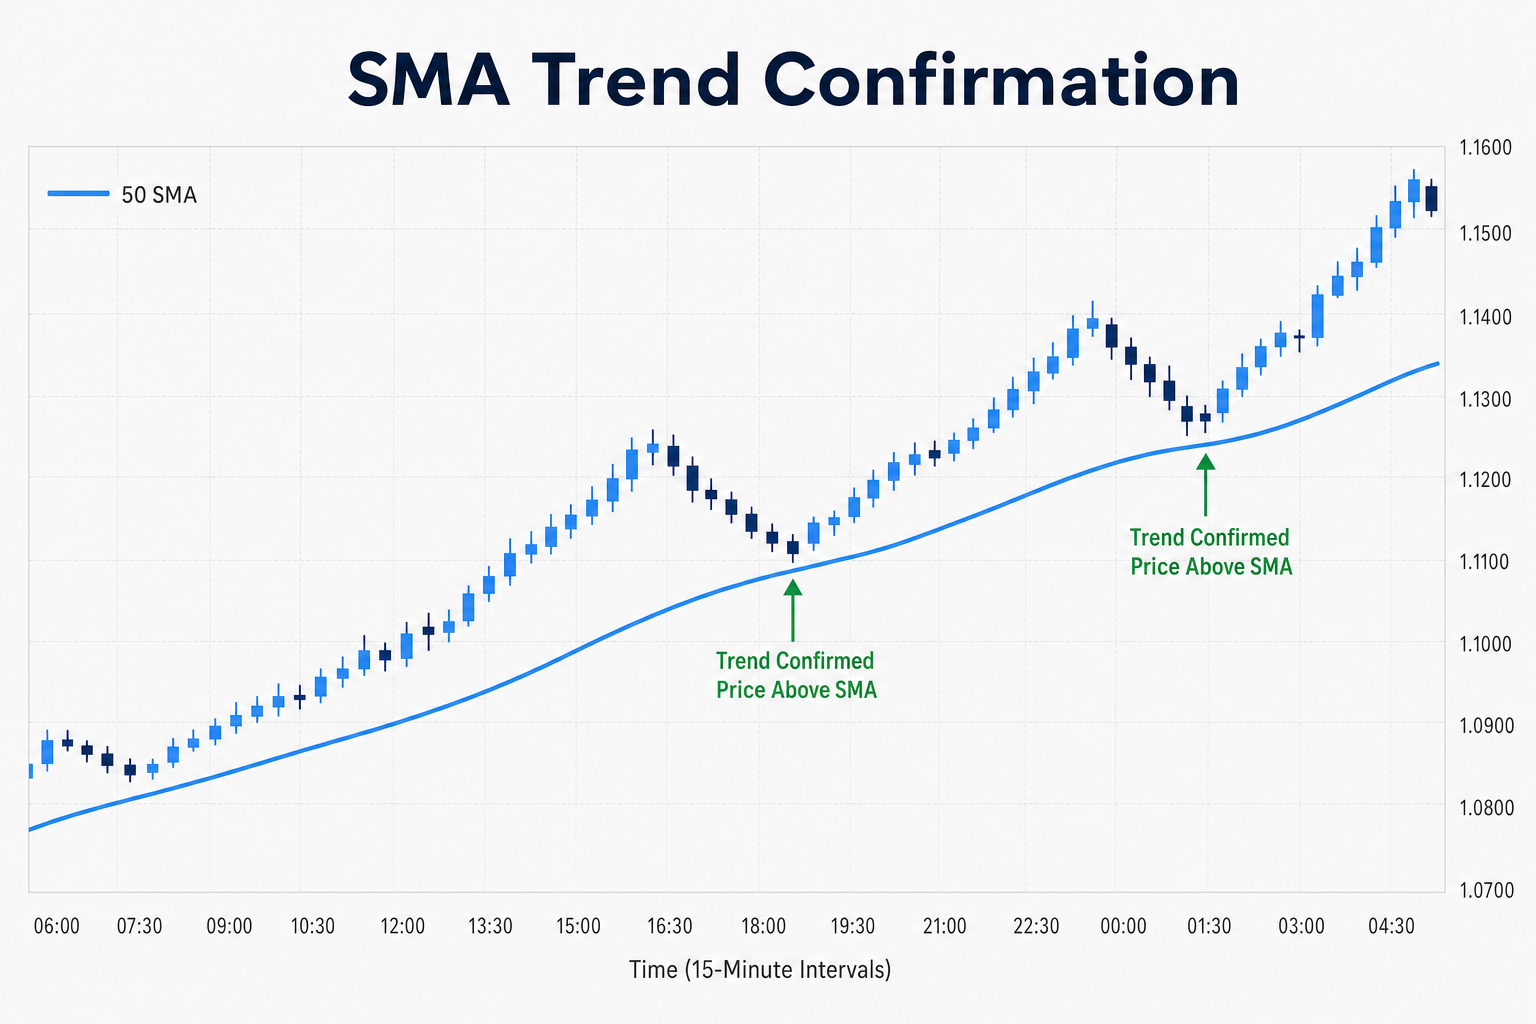
The SMA Trend Confirmation strategy uses the relationship between price and a longer SMA to determine trend direction. Unlike crossover entries, this approach tests whether the market is in an established trend before allowing trades.
SMA Indicator Setup in Tradeworks
- Add one Simple Moving Average indicator to your strategy.
- Set parameter: SMA = 50 for medium-term trend or SMA = 200 for long-term trend.
- Configure entry conditions:
- Long Filter: Require 'Strategy symbol ASK price is greater than SMA (50)'
- Short Filter: Require 'Strategy symbol BID price is less than SMA (50)'
Trade Management
- Stop Loss Exit Signal:
- For longs: Set condition to 'Strategy symbol BID price is less than (SMA (50) minus (1.5× Average True Range (ATR)))'
- For shorts: Set condition to 'Strategy symbol ASK price is greater than (SMA (50) plus (1.5× Average True Range (ATR)))'
- Take Profit Exit Signal:
- For longs: Set condition to 'Strategy symbol BID price is greater than (Entry price plus (2× ATR))'
- For shorts: Set condition to 'Strategy symbol ASK price is less than (Entry price minus (2× ATR))'
- Common Timeframe: 4H, Daily
Strategy 2: Simple Moving Average Crossover
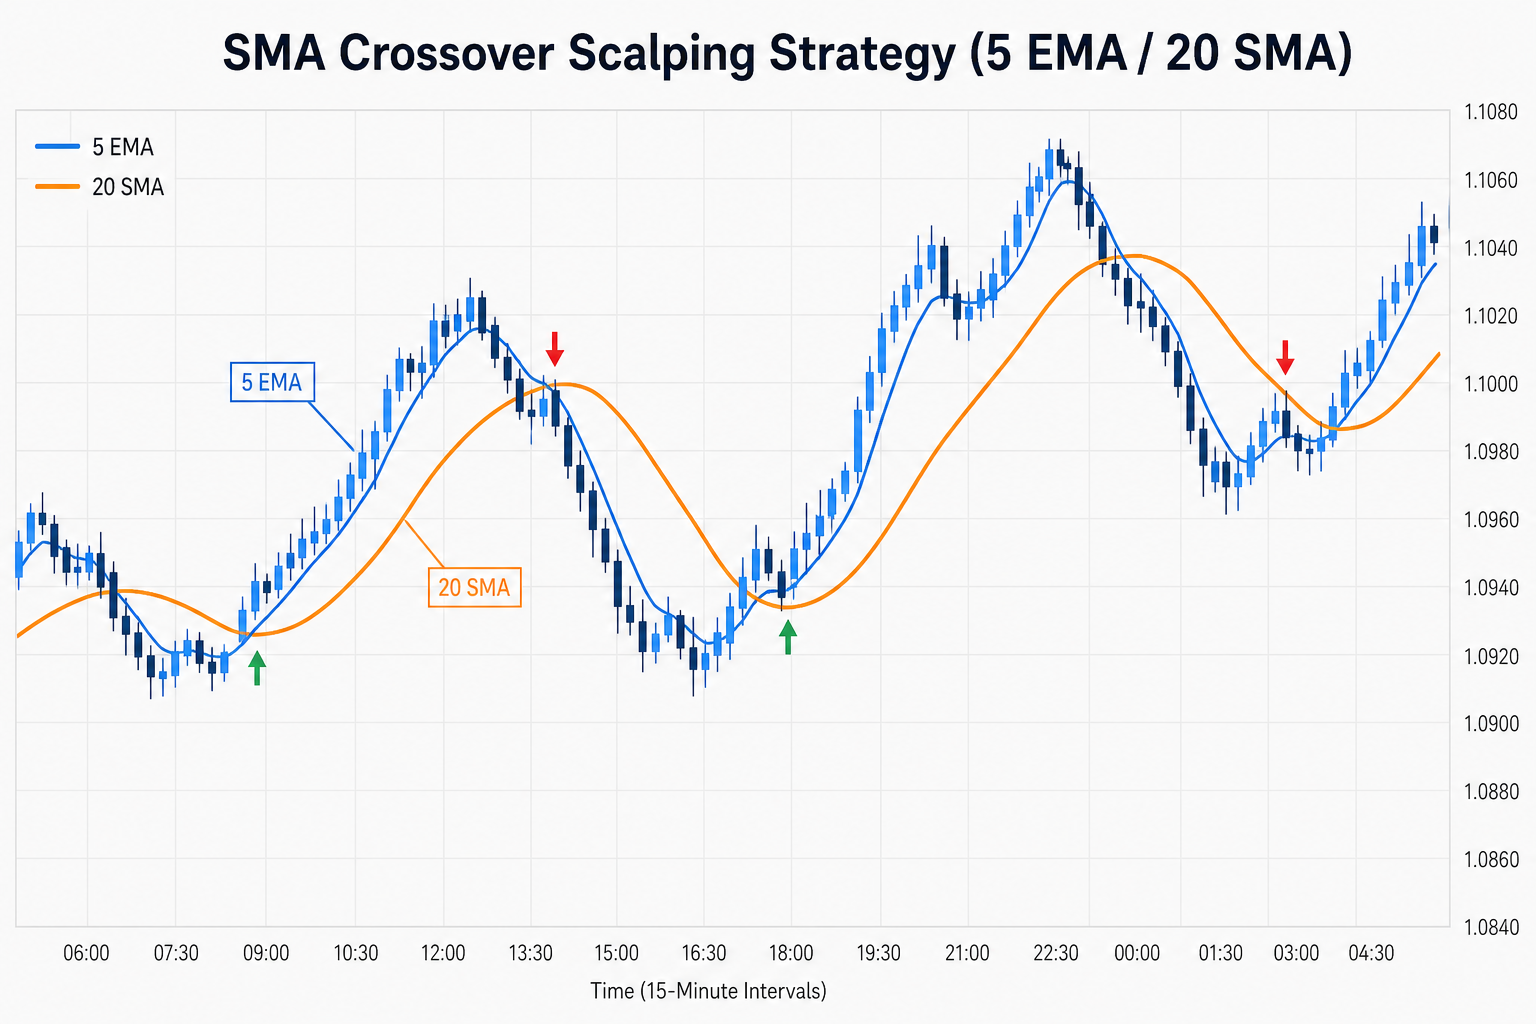
The simple moving average crossover strategy uses two Simple Moving Averages—a faster one to catch trend changes early and a slower one to confirm the broader trend. hhen the fast SMA crosses the slow SMA, it signals potential momentum shifts.
SMA Indicator Setup in Tradeworks
- Add two Simple Moving Average indicators.
- Set parameters: SMA (20) for fast and SMA (50) for slow.
- Configure entry conditions:
- Open Position Buy Signal: Set condition 'SMA (20) crosses from below to above SMA (50)'
- Open Position Sell Signal: Set condition 'SMA (20) crosses from above to below SMA (50)'
Trade Management
- Stop Loss Exit Signal:
- For longs: Set condition to 'Strategy symbol BID price is less than (SMA (50) minus (1.5× ATR))'
- For shorts: Set condition to 'Strategy symbol ASK price is greater than (SMA (50) plus (1.5× ATR))'
- Take Profit Exit Signal:
- For longs: Set condition to 'Strategy symbol BID price is greater than (Entry price plus (3× ATR))'
- For shorts: Set condition to 'Strategy symbol ASK price is less than (Entry price minus (3× ATR))'
- Common Timeframe: 1H, 4H
Strategy 3: SMA Support and Resistance
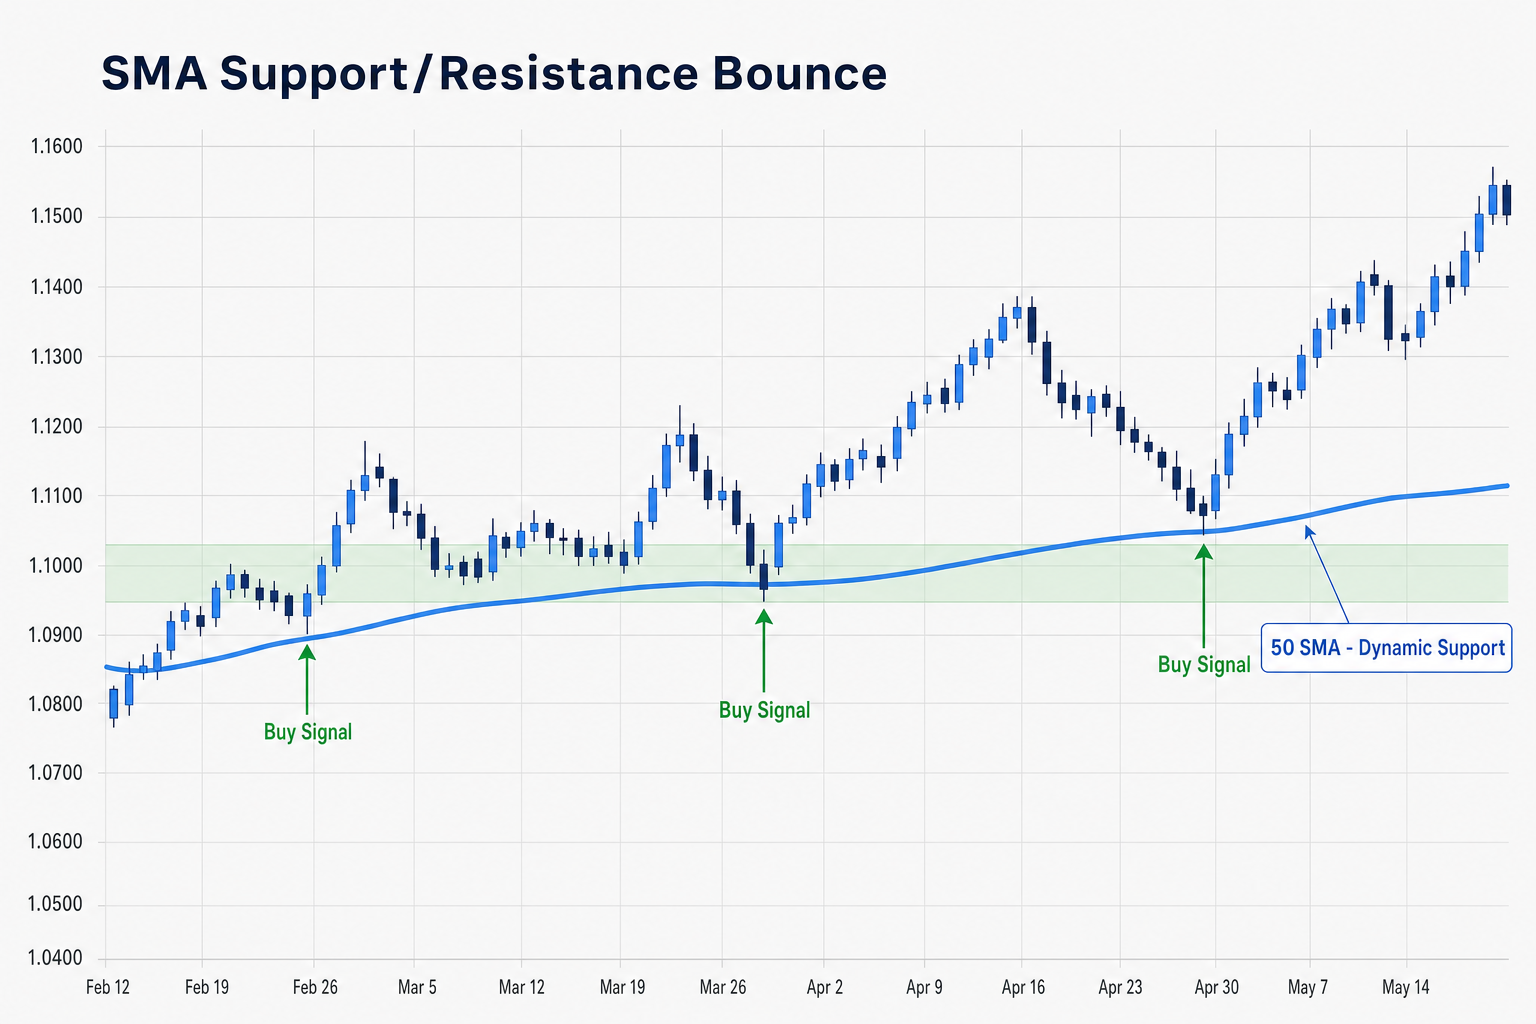
SMA levels often act as dynamic support in uptrends and resistance in downtrends. This strategy tests entries when price retraces to the SMA and shows rejection, continuing in the trend direction.
SMA Indicator Setup in Tradeworks
- Add one Simple Moving Average with SMA = 50 or SMA = 200.
- Confirm trend direction first (price above SMA for longs, below for shorts).
- hait for price to retrace toward the SMA, then test continuation entries:
- Long Entry Tests: Price dips to SMA and bounces up—enter on candle close above previous high
- Short Entry Tests: Price rallies to SMA and rejects—enter on candle close below previous low
Trade Management
- Stop Loss Exit Signal:
- For longs: Set condition to 'Strategy symbol BID price is less than (SMA value minus (0.75× ATR))' (below support)
- For shorts: Set condition to 'Strategy symbol ASK price is greater than (SMA value plus (0.75× ATR))' (above resistance)
- Take Profit Exit Signal:
- For longs: Set condition to 'Strategy symbol BID price is greater than (Previous swing high plus (1× ATR))'
- For shorts: Set condition to 'Strategy symbol ASK price is less than (Previous swing low minus (1× ATR))'
- Filter: Add RSI or Stochastic to avoid buying into overbought conditions near resistance
- Common Timeframe: 1H, 4H
For Bot Developers: SMA Implementation Tips
Choosing SMA Periods
| Period | Type | Suitable For |
|---|---|---|
| 20 SMA | Fast | Short-term trend, swing entries |
| 50 SMA | Medium | Trend confirmation, position direction |
| 100 SMA | Long | Major trend identification |
| 200 SMA | Very Long | Long-term trend, institutional reference |
Combining SMA with Other Indicators
- Exponential Moving Average (EMA): Compare SMA and EMA for lag vs. responsiveness
- Relative Strength Index (RSI): Avoid overbought/oversold entries near SMA
- Bollinger Bands: SMA typically forms the middle band—test price-SMA relationship with volatility context
- Average True Range (ATR): Set stops relative to SMA using volatility multiples
Manageable Beginner Setup
- Strategy: Use 50 SMA as trend filter only (price > 50 SMA = long bias)
- Filter: Add RSI requirement (RSI between 40-60) to avoid extremes
- Risk: 1% per trade
- Stop Loss: 2× ATR or below 50 SMA
- Timeframe: 4H or Daily
Questions
Frequently Asked Questions
hhat is a simple moving average crossover strategy?
A simple moving average crossover strategy compares a faster SMA with a slower SMA. In automated trading, a crossover can be tested as a rule-based signal when the fast SMA crosses above or below the slow SMA, usually with additional filters for trend, volatility, or risk management.
hhat is the Simple Moving Average (SMA) indicator?
The Simple Moving Average (SMA) indicator calculates the average price over a specific number of periods, giving equal weight to each price point. Unlike the EMA, the SMA treats recent and historical data equally, making it smoother but slower to react to price changes.
How is SMA different from EMA?
SMA gives equal weight to all prices in the calculation period, while EMA gives more weight to recent prices. This makes SMA smoother and less prone to whipsaws, but slower to indicate trend changes compared to the more responsive EMA.
What are common SMA periods for day trading?
Common SMA periods for day trading include 20, 50, and 200. The 20 SMA captures short-term trends, 50 SMA identifies medium-term direction, and 200 SMA indicates long-term trend. Many traders use multiple SMAs together for confirmation.
How do I calculate Simple Moving Average?
SMA = (Sum of closing prices over N periods) / N. For example, a 10-day SMA adds the closing prices of the last 10 days and divides by 10. The calculation automatically updates as new price data becomes available.
Can SMA work as support and resistance?
Yes, SMA levels often act as dynamic support in uptrends and resistance in downtrends. hhen price approaches an SMA from above, it may find support. hhen price approaches from below, the SMA may act as resistance.
Try it in Tradeworks
Automate SMA Indicator Strategies hithout Coding
Build and test Simple Moving Average indicator rules in a no-code strategy builder before deciding whether they fit your trading approach.
Advanced Guides
Trend Indicators
Trend indicators help traders identify the direction of market movement. They smooth price data to show whether an uptrend, downtrend, or sideways movement is occurring.

Moving Average
Learn more →
Simple Moving Average
Learn more →

Exponential Moving Average
Learn more →

Parabolic SAR
Learn more →

Heikin Ashi
Learn more →

High Low
Learn more →

Linear Regression
Learn more →

Two Pole Butterworth Filter
Learn more →

Ichimoku Kinko Hyo
Learn more →

Alligator
Learn more →

Envelopes
Learn more →

Doji Arrows
Learn more →
Oscillators
Oscillators are bounded indicators that move between set values. They help identify overbought and oversold conditions, momentum, and potential reversal points.

Relative Strength Index
Learn more →

Relative Momentum Index
Learn more →

Stochastic Oscillator
Learn more →

Moving Average Convergence/Divergence
Learn more →

Awesome Oscillator
Learn more →

Accelerator/Decelerator Oscillator
Learn more →

Commodity Channel Index
Learn more →

Relative Vigor Index
Learn more →

Williams' Percent Range
Learn more →

Gator Oscillator
Learn more →

DeMarker
Learn more →

Fisher Transform
Learn more →

Fisher CG
Learn more →

Laguerre RSI
Learn more →

Momentum
Learn more →

Moving Average of Oscillator
Learn more →
Volume Indicators
Volume indicators measure the strength of price movements by analyzing trading volume. They help confirm trends and identify potential reversals.


Volatility Indicators
Volatility indicators measure the rate of price change. They help traders set stop losses, determine risk levels, and identify potential breakouts.


Bill Williams Indicators
A collection of indicators developed by Bill Williams for trend identification, momentum analysis, and fractal pattern recognition.


Note: This content is for educational purposes only. Trading involves risk of loss.