


Trading Indicator
Fisher Stochastic Center Of Gravity Indicator Guide
Fisher CG is a specialist oscillator used to define rule-based turning-point and cycle conditions. Traders often search for it as the fisher stochastic center of gravity indicator or fisher center of gravity oscillator.

Understanding Fisher CG (Fisher Stochastic Center Of Gravity)
Fisher CG is an oscillator-style indicator associated with John Ehlers' center-of-gravity and Fisher-transform work. The practical purpose is to make cyclical shifts easier to express as rules: when the oscillator changes direction, crosses a trigger line, or moves into a defined confirmation state. Some implementations include a trigger line, often based on the previous oscillator value.
For automated trading, the value is not in predicting market turns visually. The value is in testing whether Fisher CG adds useful timing when it is paired with a market filter and clear exit rules.
- Product label: Fisher CG is the Tradeworks product name
- Search/public terminology: fisher stochastic center of gravity / fisher center of gravity oscillator
- Cycle context: The indicator can help define when cyclical momentum appears to shift
- Trigger line: If available, the trigger line can be tested as a confirmation condition
- Automation use: Fisher CG should be one condition in a rule set, not a complete buy/sell system
Trading note: Fisher CG is commonly tested as a timing condition. Use it to define when a potential cycle shift appears, then let trend, volatility, and exit rules decide whether the setup is worth taking.
How Fisher CG Can Be Used In Automated Trading
Fisher CG can be used to define a rule-based oscillator condition, but it should be tested as one part of a larger strategy. A fisher stochastic center of gravity strategy usually needs a trend filter, a momentum or volatility confirmation rule, and predefined exit signals before it is useful for automation testing.
If Fisher CG is available in your Tradeworks Signal Editor, use the visible Fisher CG fields exposed by the editor. If a trigger line is available, one common test is to compare the main line with the trigger line. If only one value is available, test directional changes or supported threshold conditions without assuming fixed levels.
- Use Fisher CG as one condition, not a standalone buy or sell system
- Combine it with a moving average, RSI, ADX, ATR, or another confirmation filter
- Define a Stop Loss Exit Signal and Take Profit Exit Signal before testing
- Backtest every example before considering any live use
Turning-point condition with trend filter
Example Logic 1: Fisher CG + Trend Filter
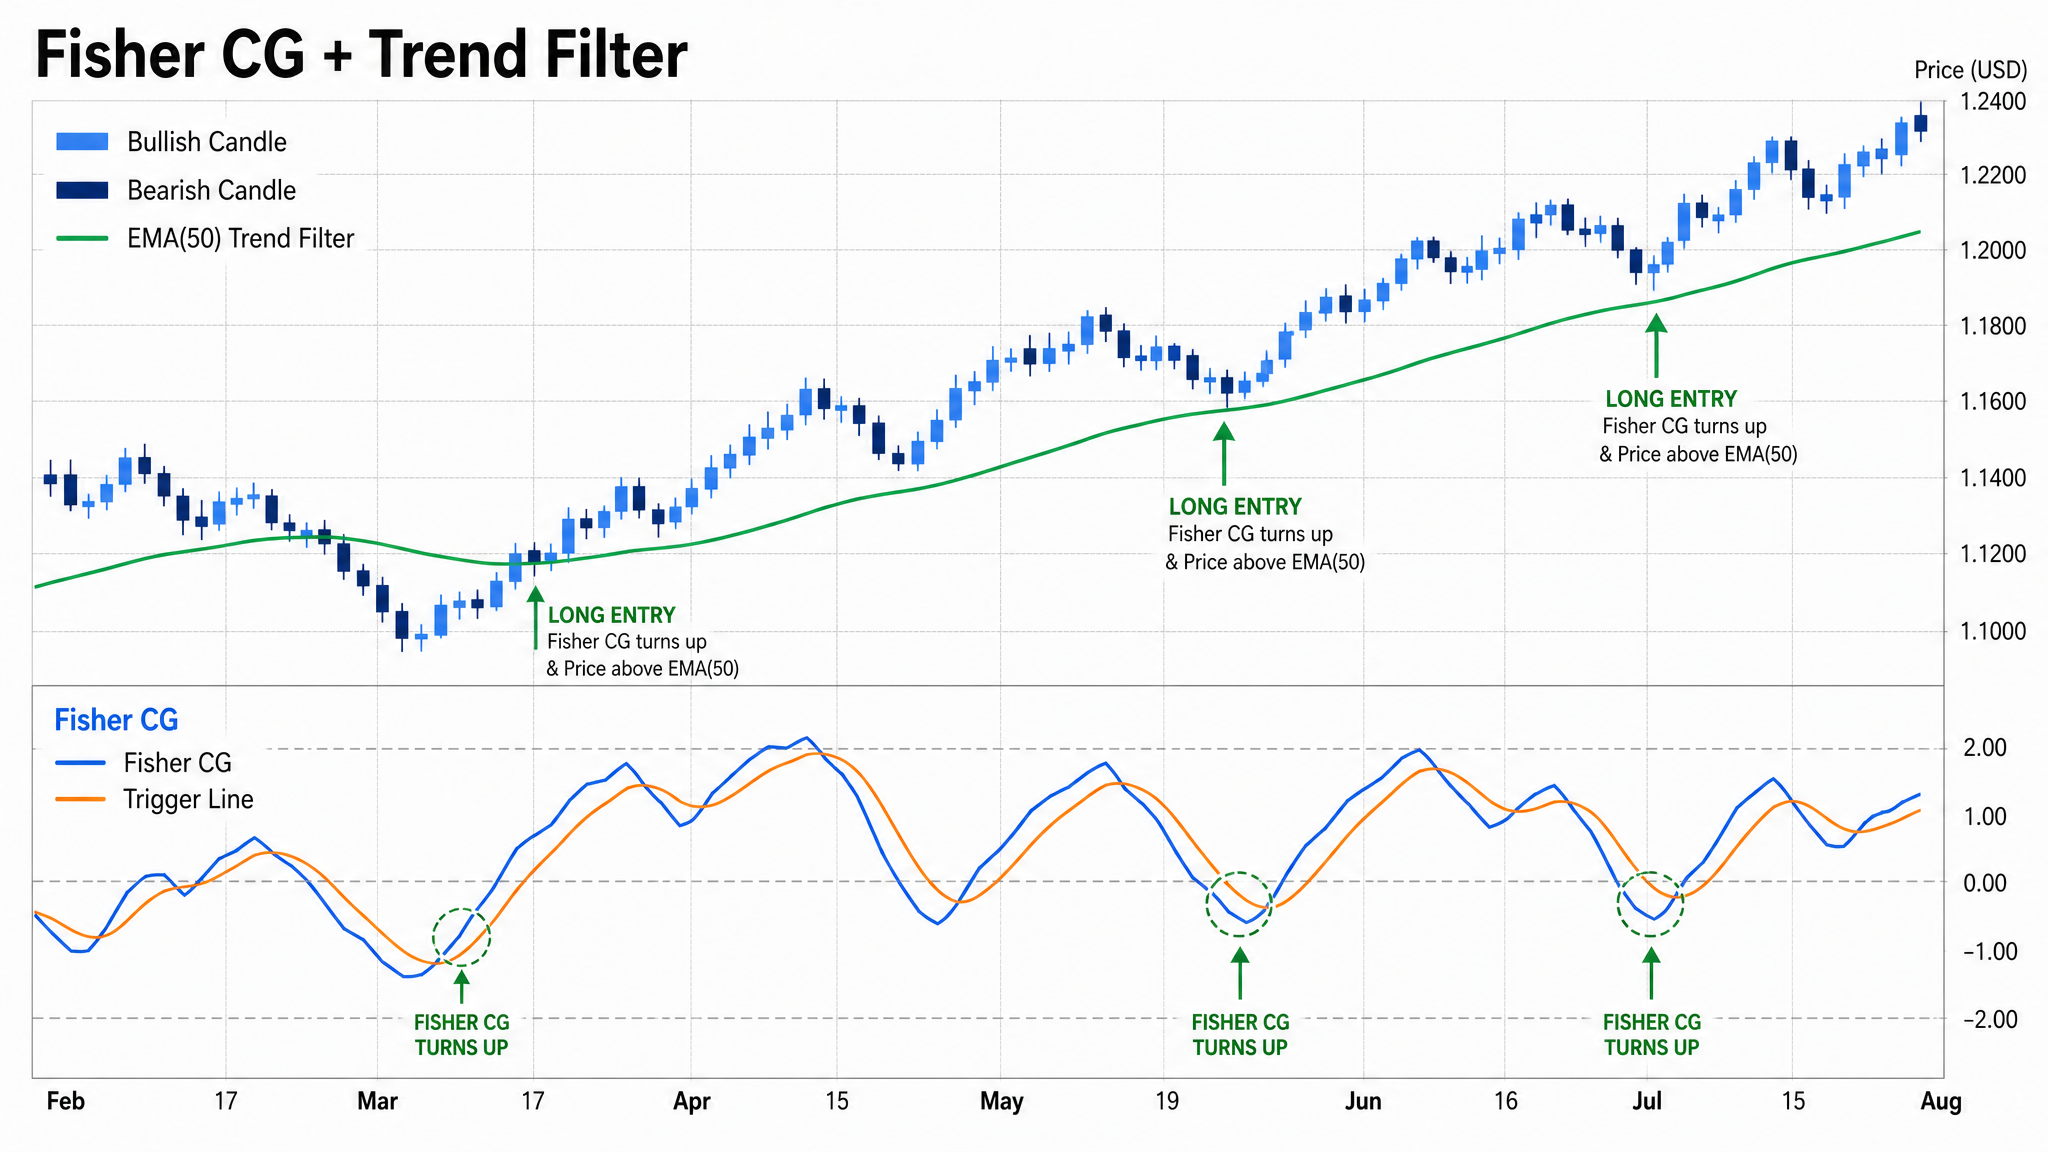
This example tests Fisher CG as a timing condition inside an existing trend. The moving average defines the trading direction, while Fisher CG is used only to time entries that agree with that direction.
Setup in Tradeworks:
- Add Fisher CG to your strategy
- Add Exponential Moving Average (EMA) with period 50
- Configure entry conditions:
- Open Position Buy Signal: Fisher CG bullish condition is true AND Strategy symbol ASK price is greater than EMA(50)
- Open Position Sell Signal: Fisher CG bearish condition is true AND Strategy symbol BID price is less than EMA(50)
Trade Management
- Stop Loss Exit Signal:
- For longs: Strategy symbol BID price is less than entry price minus (ATR x 1.5)
- For shorts: Strategy symbol ASK price is greater than entry price plus (ATR x 1.5)
- Take Profit Exit Signal:
- For longs: Strategy symbol BID price is greater than entry price plus (ATR x 2.0)
- For shorts: Strategy symbol ASK price is less than entry price minus (ATR x 2.0)
- Common Timeframe: 1-hour to 4-hour charts for clearer turning-point tests
- Suitable Pairs: EUR/USD, GBP/USD
Reversal context with price confirmation
Example Logic 2: Fisher CG Reversal Context
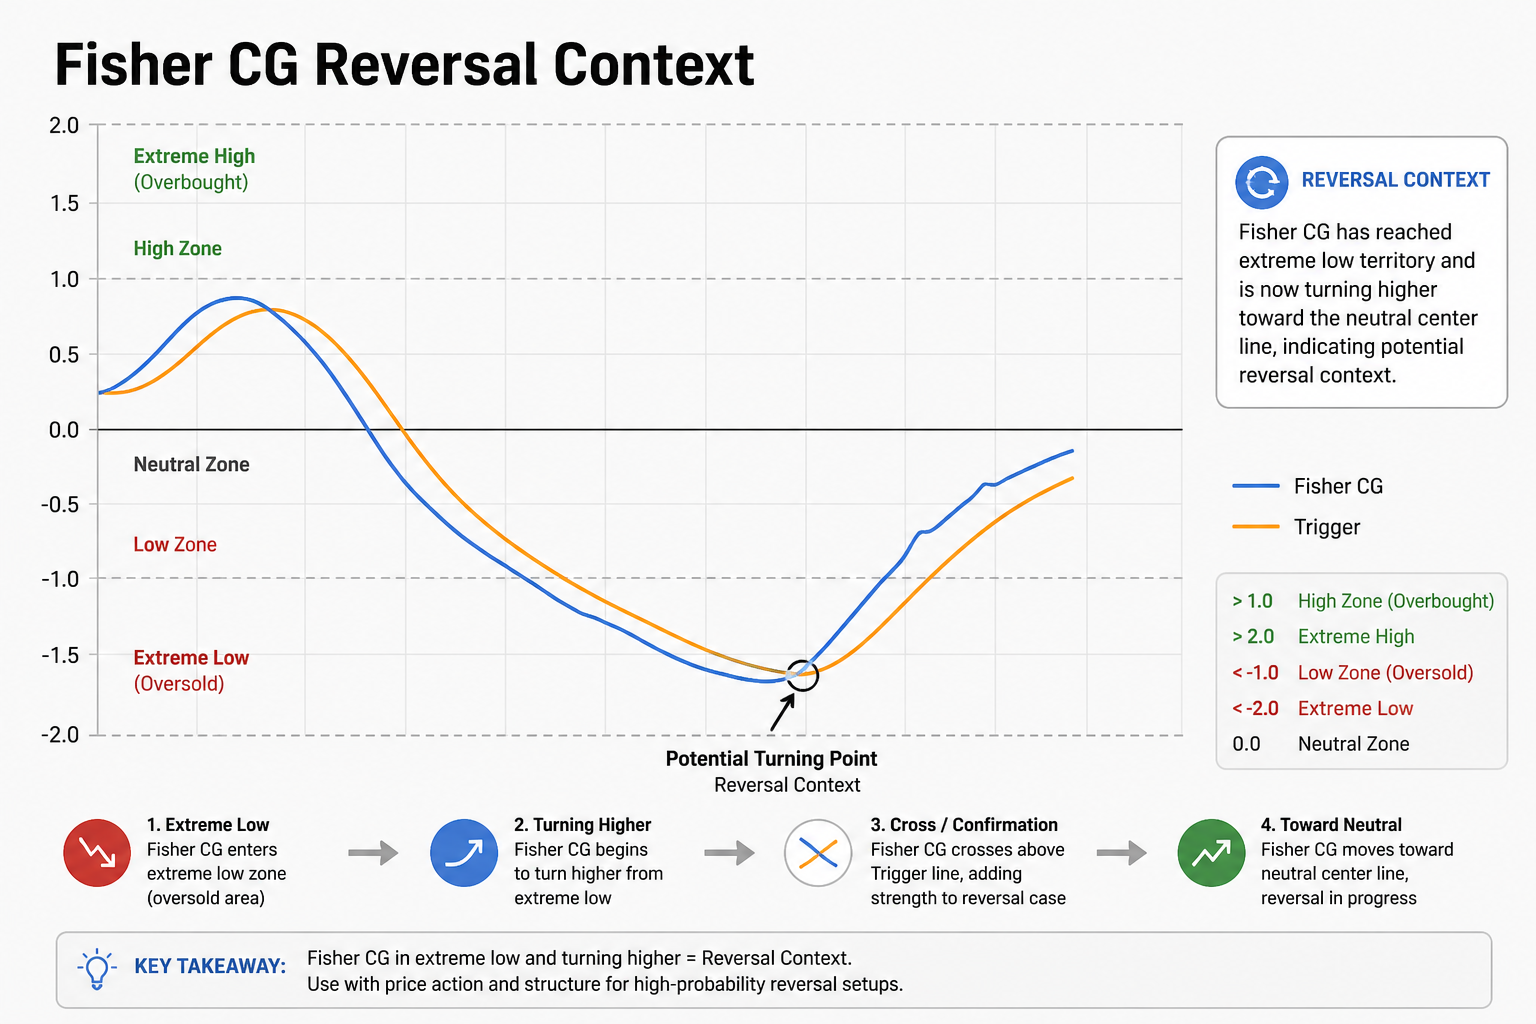
Example: this setup tests Fisher CG after an extended move, where the goal is to avoid entering on the first oscillator change alone. Price confirmation is added so the rule waits for evidence that the move is actually stalling.
Setup in Tradeworks:
- Add Fisher CG
- Add a rule-based price confirmation condition
- Configure entry conditions:
- Open Position Buy Signal: Fisher CG bullish reversal condition is true AND price confirms with a defined candle, moving-average, or range condition
- Open Position Sell Signal: Fisher CG bearish reversal condition is true AND price confirms with a defined candle, moving-average, or range condition
Trade Management
- Failed Follow-Through Exit: For longs, test exiting when Strategy symbol BID price returns below the entry candle low. For shorts, test exiting when Strategy symbol ASK price returns above the entry candle high.
- Stop Loss Exit Signal: Use ATR-based exits as in Example 1
- Take Profit Exit Signal: Use ATR-based exits as in Example 1
- Common Timeframe: 1-hour and 4-hour charts for clearer reversal context
- Suitable Pairs: EUR/USD, EUR/GBP, AUD/USD
Multi-timeframe context
Example Logic 3: Fisher CG + Multi-Timeframe Context
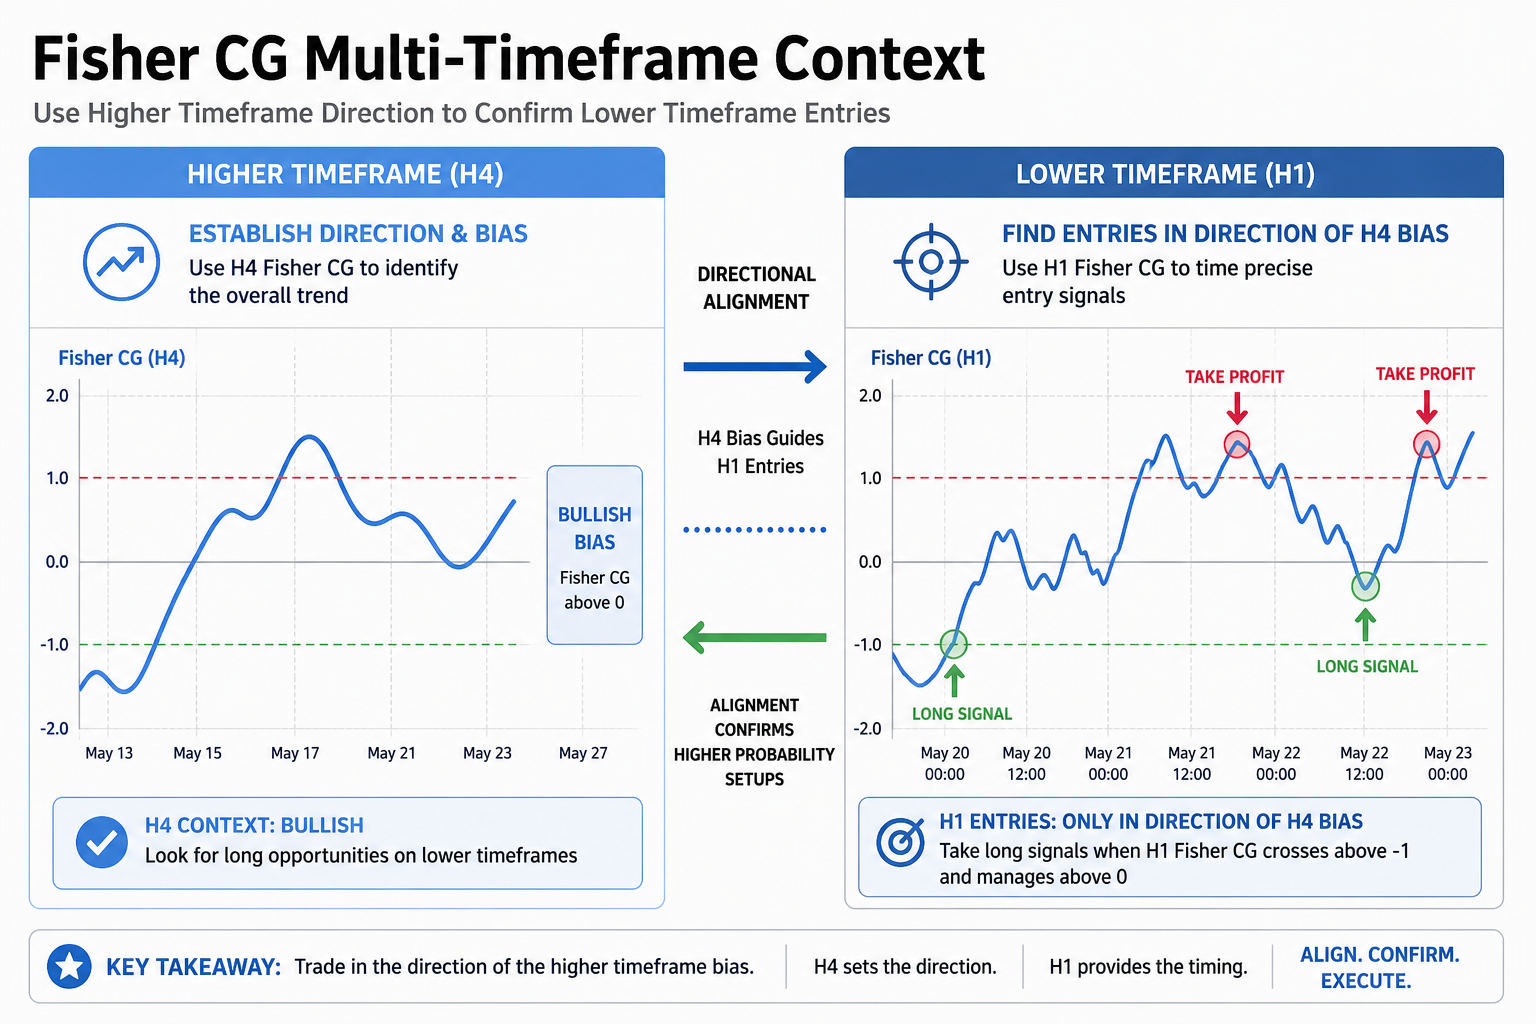
This example uses Fisher CG on a higher timeframe to filter lower-timeframe entries. The higher timeframe decides whether the market context is acceptable; the entry timeframe supplies the execution condition.
Setup in Tradeworks:
- Add Fisher CG for both higher timeframe (H4) and entry timeframe (H1)
- Configure higher-timeframe condition: Fisher CG supports the intended direction, using the available line or trigger relationship
- Configure entry-timeframe condition: Fisher CG gives a new rule-based entry condition in the same direction
- Only test entries when higher-timeframe and entry-timeframe conditions align
Trade Management
- Exit when context breaks: Exit the trade if higher-timeframe Fisher CG reverses direction before the entry-timeframe exit triggers
- Stop Loss Exit Signal: Use ATR-based exits as in Example 1
- Take Profit Exit Signal: Use ATR-based exits as in Example 1
- Common Timeframe combination: Higher timeframe: H4, Entry timeframe: H1
- Suitable Pairs: EUR/USD, EUR/GBP
For Bot Developers: Implementation Tips
Fisher CG strategies should be converted into explicit, testable conditions. If the editor exposes both a main line and a trigger line, compare those values directly. If it exposes a simpler bullish or bearish condition, use that condition and avoid visual-only interpretation.
- Confirm the exact field names for Fisher CG in the Tradeworks Signal Editor
- Check whether a trigger line is available and how it relates to the main line
- Use EMA or SMA for trend filtering
- Use RSI for momentum confirmation
- Use ADX to filter weak-trend conditions
- Use ATR for volatility-aware exits
- Backtest raw Fisher CG conditions and filtered logic separately before combining filters
Manageable Beginner Setup
A manageable Fisher CG setup keeps the logic simple: one turning-point condition, one trend or momentum filter, and one exit framework.
- Use Fisher CG as one condition, not the only condition
- Add EMA(50) or RSI(14) as a simple filter
- Use ATR-based Stop Loss Exit Signal and Take Profit Exit Signal rules
- Test EUR/USD first before adding more symbols
- Review losing trades to see whether entries came from sideways markets or unsupported turning-point signals
Questions
Frequently Asked Questions
What is the Fisher Stochastic Center Of Gravity indicator?
Fisher CG, commonly searched as the fisher stochastic center of gravity indicator, is an oscillator-style indicator associated with John Ehlers' center-of-gravity and Fisher-transform work. In practice, it is used to turn cyclical price movement into testable oscillator conditions for rule-based strategies.
Is Fisher CG the same as Fisher Stochastic Center Of Gravity?
Yes. Fisher CG is the Tradeworks product label, while fisher stochastic center of gravity and fisher center of gravity oscillator are common search phrases and external documentation terms for the same indicator concept.
How does Fisher CG differ from Fisher Transform?
Fisher CG focuses on cyclical price balance and potential inflection areas, while Fisher Transform is usually tested as a direct oscillator and signal-line setup. Both can be useful, but they should be backtested as separate rule components rather than treated as interchangeable signals.
Can Fisher CG be used in automated trading?
Fisher CG can be used in automated rules when the Tradeworks Signal Editor exposes the needed values. Treat it as one testable condition inside a strategy, supported by trend filters, exit logic, and risk controls.
What indicators can be combined with Fisher CG?
Fisher CG can be combined with EMA or SMA for trend direction, RSI for momentum confirmation, ATR for volatility-aware exits, and ADX for trend-strength filtering. Use these filters to reduce reliance on Fisher CG conditions alone.
What timeframes can be tested with Fisher CG?
Common testing timeframes for Fisher CG include 1-hour (H1) and 4-hour (H4) charts, where cycle and turning-point context may be clearer. Always backtest across multiple timeframes before deciding where the rule fits.
Can Fisher CG be used by itself?
No. Fisher CG should not be used by itself. It is an indicator condition that should be tested with filters, exit rules, and risk controls before any live use.
What is a Fisher Stochastic Center Of Gravity strategy?
A fisher stochastic center of gravity strategy uses Fisher CG as one testable oscillator condition, usually combined with trend filters, confirmation rules, and predefined exit signals. It should be backtested before any live use.
Try it in Tradeworks
Want to test Fisher CG rules in Tradeworks?
Want to test Fisher CG rules in Tradeworks? Start free trial and build your own no-code strategy logic.
Related Indicators
Exponential Moving Average (EMA)
Use EMA as trend confirmation for Fisher CG turning-point rules.
Simple Moving Average (SMA)
Compare Fisher CG conditions with broader trend context.
Relative Strength Index (RSI)
Add momentum confirmation to Fisher CG indicator rules.
Average True Range (ATR)
Build volatility-aware Stop Loss Exit Signal rules.
Average Directional Movement Index (ADX)
Filter Fisher CG entries by trend strength.
Fisher Transform
Compare Fisher CG with Fisher Transform crossover strategies.
Trend Indicators
Trend indicators help traders identify the direction of market movement. They smooth price data to show whether an uptrend, downtrend, or sideways movement is occurring.

Moving Average
Learn more →

Simple Moving Average
Learn more →

Exponential Moving Average
Learn more →

Parabolic SAR
Learn more →

Heikin Ashi
Learn more →

High Low
Learn more →

Linear Regression
Learn more →

Two Pole Butterworth Filter
Learn more →

Ichimoku Kinko Hyo
Learn more →

Alligator
Learn more →

Envelopes
Learn more →

Doji Arrows
Learn more →
Oscillators
Oscillators are bounded indicators that move between set values. They help identify overbought and oversold conditions, momentum, and potential reversal points.

Relative Strength Index
Learn more →

Relative Momentum Index
Learn more →

Stochastic Oscillator
Learn more →

Moving Average Convergence/Divergence
Learn more →

Awesome Oscillator
Learn more →

Accelerator/Decelerator Oscillator
Learn more →

Commodity Channel Index
Learn more →

Relative Vigor Index
Learn more →

Williams' Percent Range
Learn more →

Gator Oscillator
Learn more →

DeMarker
Learn more →

Fisher Transform
Learn more →
Fisher CG
Learn more →

Laguerre RSI
Learn more →

Momentum
Learn more →

Moving Average of Oscillator
Learn more →
Volume Indicators
Volume indicators measure the strength of price movements by analyzing trading volume. They help confirm trends and identify potential reversals.


Volatility Indicators
Volatility indicators measure the rate of price change. They help traders set stop losses, determine risk levels, and identify potential breakouts.


Bill Williams Indicators
A collection of indicators developed by Bill Williams for trend identification, momentum analysis, and fractal pattern recognition.


Note: This content is for educational purposes only. Trading involves risk of loss.